top of page
Data Sources and Visualization Tools
Python
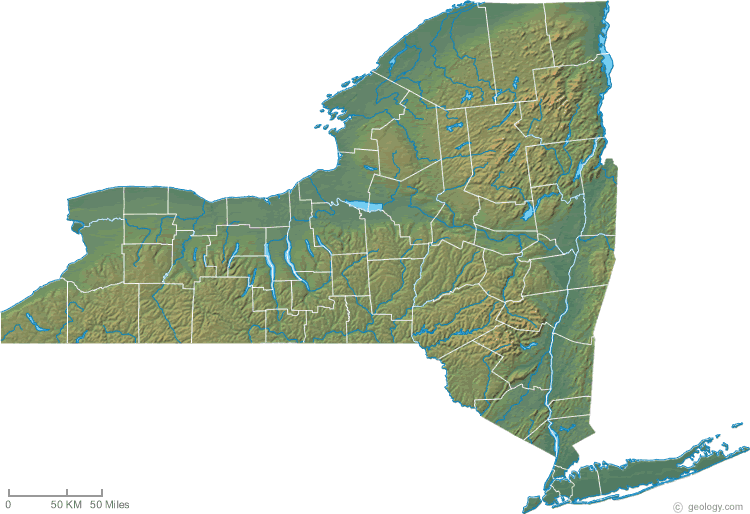
Data Mining - Collect twitter data with REST API with Python, using key words "gun control" and "gun rights", in addition to geocoordinates for New York state for the query
ArcGIS
Point Pattern Analysis - Temporal and Spatial Distribution
Gephi
Network Analysis - visualize the connectivity among the most important nodes
Tableau
Data Visualization - display and compare the top mentioned users, active users, most common hashtags and other attributes among both collections

bottom of page